WickScan Predicted a 37-Point MES Move — Here's the Proof
WickScan Research
WickScan
Every trader has stared at a chart wondering, "What am I looking at?" This morning's Micro E-mini S&P 500 session was a perfect example — price chopping around in the 6,451–6,475 range on a 30-second timeframe. We uploaded the chart to WickScan mid-session to see what the AI would find.
WickScan identified key patterns and levels, predicted the uptrend, and mapped exactly where price was heading. Then we watched it play out in real time.
The WickScan Prediction
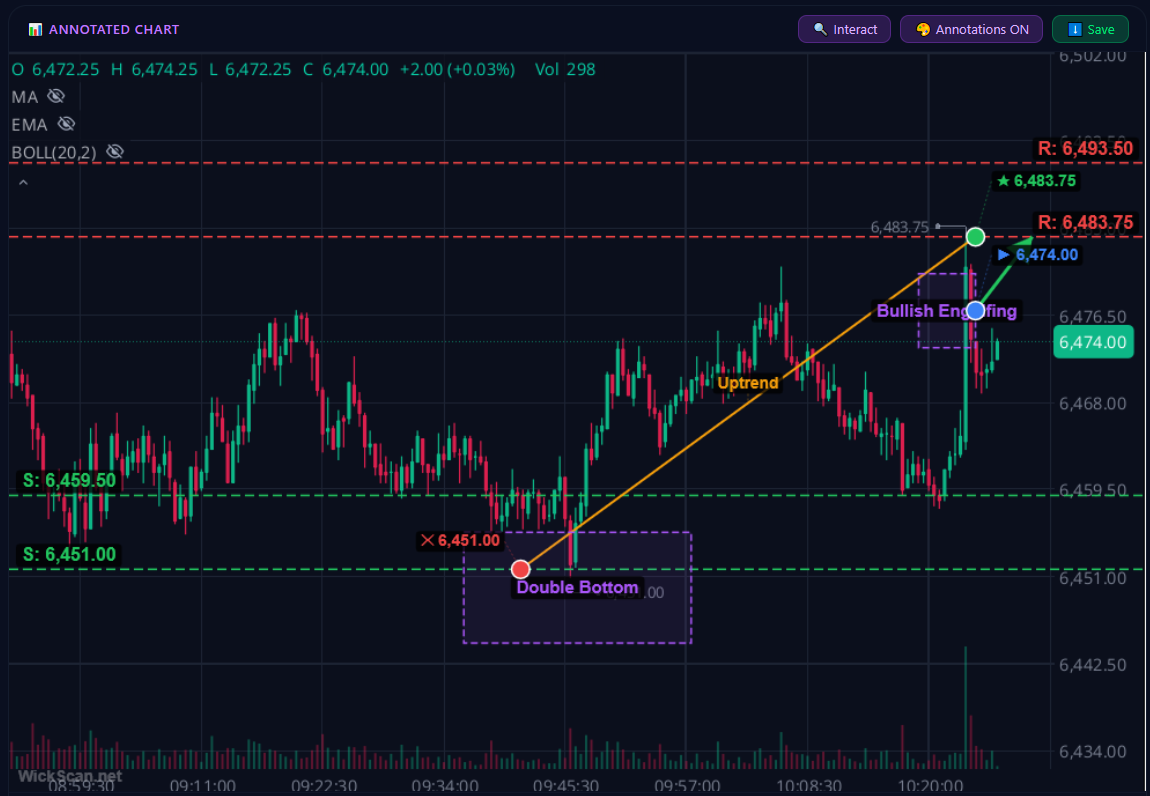
WickScan identified a Double Bottom at 6,451, drew the uptrend, flagged a Bullish Engulfing, and mapped S/R levels — all before the move completed.
What WickScan Found
Double Bottom at 6,451.00
Two failed attempts to break below 6,451 formed a textbook reversal pattern. WickScan boxed the formation and flagged the critical support level — the foundation of the entire move.
Uptrend Confirmation
Once the double bottom held, WickScan drew the trendline showing the clean shift from consolidation into a sustained upward trajectory toward resistance.
Bullish Engulfing Candle
Near the top of the move, WickScan detected a bullish engulfing pattern — a larger green candle fully consuming the prior red candle, confirming continued buying pressure.
Support & Resistance Auto-Mapped
Key levels identified instantly — no manual drawing required:
- R2: 6,493.50 — Upper resistance zone
- R1: 6,483.75 — First resistance / session high
- S1: 6,459.50 — Intermediate support
- S2: 6,451.00 — Major support / double bottom
The Actual Result
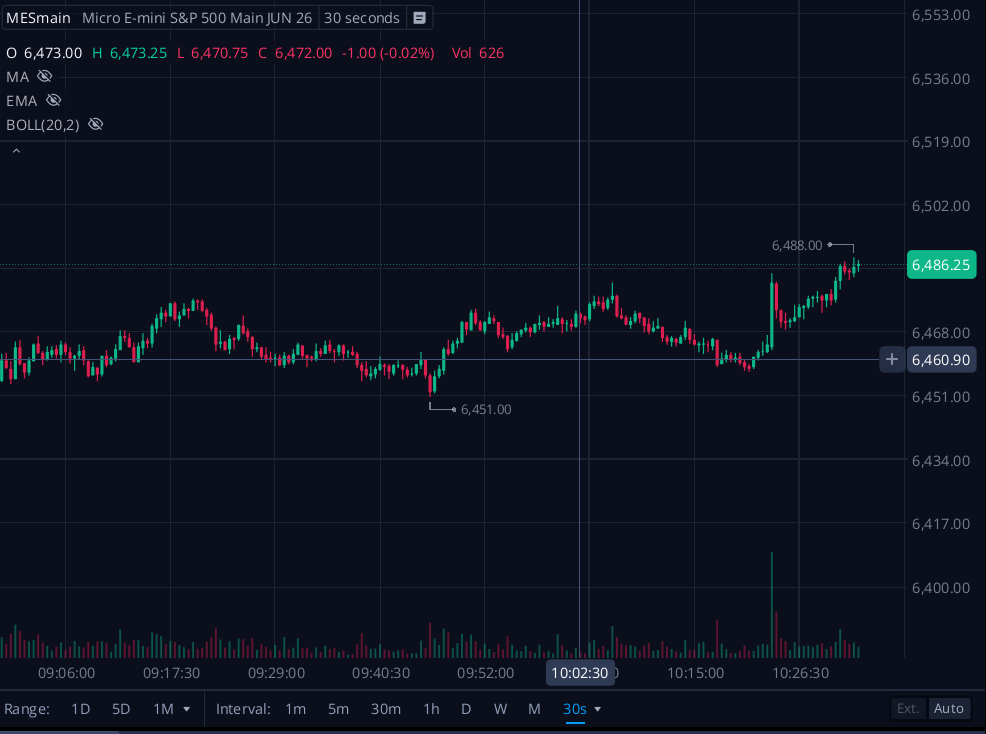
Price followed the predicted path — rallying from the 6,451 double bottom through resistance to a high of 6,488. The prediction played out exactly as mapped.
+37 Points on MES — Predicted Before It Happened
WickScan called the move from the 6,451 double bottom to 6,488 — before it happened. The result chart proves it played out exactly as predicted. That's a 37-point move on MES, fully mapped by AI before most traders even recognized the setup.
Why This Matters
No guesswork. Support, resistance, and patterns are detected automatically. Speed. WickScan annotates charts in seconds — not minutes of manual drawing. Confidence. Multiple confirmations (double bottom + trendline + bullish engulfing) stacked together give you a clearer read on direction.
Upload any chart to WickScan and see what patterns you're missing.
Disclaimer: This article is for educational and informational purposes only. It does not constitute financial advice. Trading involves risk of loss. Always do your own research before making trading decisions.
Sharpen Your Edge
Upload any candlestick chart and get AI-powered pattern recognition, support/resistance levels, and trade considerations in seconds.
Try WickScan Free